Introduction
In this section of the Executive Board’s report, we focus our attention on the financial aspects that affected Erasmus University Rotterdam (EUR) in the past year and take a look at the future. After all, the financial health of our university is a precondition for achieving our mission and objectives.
The financial landscape in which EUR operates is constantly changing. External developments occur in rapid succession and have an impact on society as a whole, and therefore also on EUR, its students and staff.
Calmer waters do not appear to be on the horizon for the time being. Changes in university funding, the uncertain effects of political developments (such as the arrival of a new government) and extreme price increases that are only partially compensated by the Ministry of Education, Culture and Science (OC&W) are putting pressure on our internal organisation. These developments require a meticulous approach and strategic planning to ensure that EUR remains financially stable and can continue to fulfil its core tasks. In this section, we discuss the financial state of EUR in further detail, including an analysis of our financial results, investments and the measures taken to strengthen and future-proof our financial position. We also render account for compliance with our treasury policy, the Clarity Memorandum and the policy rules on investment of public funds in private activities. In accordance with the Code of Good Governance, we also report on the expenses of the Executive Board. Finally, we render account for the use of NPO and Administrative Agreement funds.
Financial position
table 13
| In € million | Actuals 2023 | Actuals 2022 | Budget for 2023 | Deviation from budget | Difference to 2022 | |
|---|---|---|---|---|---|---|
| Central government grant | 429,8 | 406,4 | 446,0 | -16,2 | 23,4 | |
| Tuition fees | 80,9 | 59,0 | 80,1 | 0,8 | 21,9 | |
| Income from work commissioned by third parties | 236,0 | 218,9 | 221,8 | 14,2 | 17,1 | |
| Other income | 115,8 | 125,7 | 111,2 | 4,6 | -9,9 | |
| Total income | 862,5 | 810,0 | 859,1 | 3,4 | 52,5 | |
| Personnel expenses of staff on payroll | 572,0 | 514,6 | 604,3 | -32,3 | 57,4 | |
| Staff not on payroll | 37,9 | 37,1 | 32,9 | 5,0 | 0,8 | |
| Depreciation | 54,1 | 39,1 | 44,1 | 10,0 | 15,0 | |
| Premises costs | 41,7 | 36,6 | 44,5 | -2,8 | 5,1 | |
| Other expenses | 187,2 | 177,4 | 166,5 | 20,7 | 9,8 | |
| Total expenses | 892,9 | 804,8 | 892,3 | 0,6 | 88,1 | |
| Net income (expense) | -30,4 | 5,2 | -33,2 | 2,8 | -35,6 | |
| Financial income and expenses | 7,5 | 12,0 | 0,6 | 6,9 | -4,5 | |
| Taxes | 0,2 | 0,0 | 0,0 | 0,2 | 0,2 | |
| Result for the year | -22,7 | 17,2 | -32,6 | 9,9 | -39,9 | |
| Third-party share of result | -3,0 | 5,5 | -17,0 | 14,0 | -8,5 | |
| Net result for the year | -19,7 | 11,7 | -15,6 | -4,1 | -31,4 |
Analysis of 2023 result
The consolidated net result was € -19.7 million, after deduction of the Third-party share of the result[1] of € -3.0 million.
The consolidated net result of € -22.7 million, including the result of the Faculty of Medicine and Health Sciences (FGG)/Erasmus MC, is the starting point for the normalised result explained below (the result excluding significant non-recurring items).
The negative result, including FGG/Erasmus MC, is significantly affected by the non-recurring income and expenses in the following table:
[1] Refers to the result achieved from the E&R activities of Erasmus MC. In accordance with the accounting rules, only the income and expenses of the E&R activities are consolidated in EUR financial statements. As the result realised from the E&R activities is earmarked for the Erasmus MC, this amount is ultimately deducted from the total result in the operating account.
Normalised result for 2023 including FGG/Erasmus MC result
table 14
| Amounts x € 1 million | 2023 | 2022 | Difference between 2023 and 2022 | |
|---|---|---|---|---|
| Pre-adjustment result | -22,7 | 17,2 | -39,9 | |
| 1. Impairment of capitalised Eread planning costs | 14,2 | |||
| 2. Addition to reorganisation provision | 6,3 | |||
| 3. Result from sale of equity interests | -3,8 | |||
| 4. CLA effect on (other) staffing costs | 5 | |||
| 5. Initial creation of vitality provision | 2,2 | |||
| 6.Release of coverage for overheads of non-normative central government grants (2022 portion) | -2,4 | |||
| Total non-recurring effects on result | 21,5 | -21,6 | ||
| Post-adjustment result | -1,2 | -4,4 | 3,2 |
The adjusted result, including the FGG/Erasmus MC result, is significantly better than the result according to the consolidated financial statements, but still negative. The adjustment relates to:
- Impairment of capitalised planning costs due to amended real estate plans for the Eread project.
- The significant addition to the reorganisation provision, which is non-recurring and therefore considered an adjustment.
- The sales result arising from the disposal of equity interests in HBM and Quantib/Radnet.
- The impact of the CAO increase on employee benefit provisions, which was so high in 2023 (9% as of 1 August 2023) that it can be considered as non-recurring.
- The vitality provision initially created and charged to the statement of income and expenditure. The vitality provision was not previously created and therefore applied as an adjustment.
- The movement (a gain recognised in operations) pertaining to the balance sheet item starting and incentive grants and relating to the coverage of overheads. Because € 2.4 million of this amount relates to funds received in 2022 but whose movement is thus recognised in the current financial year 2023, this has been corrected to arrive at the normalised operating result for 2023.
The first three adjustments affected the result (third-party share) of FGG/Erasmus MC for the year 2023.
Comparison with 2022 actuals
Income relative to the 2022 actuals
- The central government grant increased in 2023 due to the Administrative Agreement.
- The increase in tuition fee income was mainly caused by the removal of the temporary measure during the COVID pandemic in which tuition fees were halved.
- Income from work commissioned by third parties was higher, of which €14.5 million was generated at the Faculty of Medicine and Health Sciences. This relates to an increase in EMF research activities and an increase in rates (indexation). There was also a shift from secondment (other income) to EMF research activities. Finally, the increase was caused by higher income from delivered contract education.
- Other income was lower, of which € 8 million was generated at the Faculty of Medicine and Health Sciences. In 2022, Erasmus MC (E&R) allocated part of its central government grant received for the workshop function to the E&R activities within Other income. Charging on was also lower due to more of a shift towards EMF research activities for Erasmus MC (E&R).
Expenses relative to the 2022 actuals
- The increase in total Personnel expenses was caused by a combination of the CLA increase and an increase in the average number of FTEs.
- Depreciation charges in 2023 increased due to an impairment on capitalised planning and preparation costs for the Eread real estate project (FGG/ Erasmus MC) of € 14.2 million.
- Premises costs increased in 2023 due to increased maintenance carried out in 2023. This included both periodic and occasional maintenance. Maintenance costs were higher than in 2022 due to indexation.
- The Third-party share of the result concerns Erasmus MC’s share of the result from education and research activities. The result in 2023 was lower than in 2022 and was significantly affected by a number of non-recurring items as included in the above table showing the adjustments applied (including the FGG/Erasmus result). The non-recurring contribution from Erasmus University Rotterdam was included in the Third-party share of the result. Increasing EMF research funds in 2023 also affected the 2023 result (compared to 2022).
Balance sheet and development in cash flows
table 15
| Assets | |||||
|---|---|---|---|---|---|
| Fixed assets | |||||
| Intangible fixed assets | 3,0 | 7,6 | 11,6 | 11,6 | 11,6 |
| Tangible fixed assets | 289,8 | 288,8 | 345,4 | 385,4 | 375,6 |
| Financial fixed assets | 1,5 | 0,4 | 0,4 | 0,4 | 0,4 |
| Total fixed assets | 294,3 | 296,8 | 357,4 | 397,4 | 387,6 |
| Current assets | |||||
| Inventories | 0,0 | 0,0 | 0,0 | 0,0 | 0,0 |
| Receivables from tuition fees | 0,7 | 1,5 | 1,6 | 1,7 | 1,7 |
| Other receivables | 39,1 | 37,0 | 36,5 | 36,5 | 36,5 |
| Cash and cash equivalents | 148,6 | 95,6 | 52,9 | 23,3 | 41,3 |
| Total current assets | 188,4 | 134,1 | 91,0 | 61,5 | 79,5 |
| Total assets | 482,7 | 430,9 | 448,4 | 458,9 | 467,1 |
| Liabilities | |||||
| Equity | 211,1 | 190,3 | 190,3 | 190,3 | 190,3 |
| Provisions | 26,0 | 22,3 | 22,3 | 22,3 | 22,3 |
| Non-current liabilities | 7,3 | 6,8 | 6,5 | 6,2 | 5,9 |
| Current liabilities | 238,3 | 211,5 | 229,3 | 240,1 | 248,6 |
| Total liabilities | 482,7 | 430,9 | 448,4 | 458,9 | 467,1 |
Assets relative to the 2023 budget
Assets relative to the 2023 budget
- Tangible fixed assets were higher than budgeted, mainly due to a miscalculation of budgeted investments for the year 2023. The budgeted capital expenditure was included as an incoming cash flow, whereas this is an outgoing cash flow. This has been amended for the 2024 budget.
- Cash and cash equivalents were significantly higher than budgeted. Budgeted investments were miscalculated for the year 2023 (see notes on Tangible fixed assets). Cash and cash equivalents were also notably higher than budgeted due to additional funds received under the Administrative Agreement in 2023, but budgeted lower for 2023.
Liabilities compared to the 2023 budget
- Equity was significantly higher than budgeted primarily due to the cumulative difference in actual and budgeted results over the past years. Equity as at year-end 2022 was € 230.8 million (actuals) and budgeted equity € 207.2 million. Furthermore, the negative initial budget result for FGG/Erasmus MC for 2023 (amounting to € 17 million negative) was incorrectly included as part of budgeted equity for 2023. The actual result for the year 2023 did not deviate significantly from the budget result.
- Current liabilities were higher than budgeted mainly due to additional funds received under the Administrative Agreement in 2023, but not spent in full in 2023. The unspent part of the Administration Agreement funds is included in current liabilities. However, the budget does not take into account the accrual of unspent Administration Agreement funds in the balance sheet. In addition, the liability for holiday allowance and holiday time was higher due to the higher CLA indexation in 2023 than budgeted.
Assets relative to the 2022 actuals
- Tangible fixed assets decreased partly due to straight-line depreciation on land and buildings and inventory and fixtures, fittings and equipment. Investments mainly related to various real estate investments in the context of the CiO III programme, including the renovation of the lecture halls in the J Building, various investments in fixtures, fittings and equipment and investments in geothermal heat pump (GHP) systems for the various buildings. The investments classified as In progress and prepayments were not depreciated as they were not yet operational in 2023 and mainly relate to investments in GHP systems.
- Cash and cash equivalents increased in 2023, due to funds received in 2023 under the Administrative Agreement that have not yet been spent in full. This had a positive impact on working capital and operating cash flow in 2023.
Liabilities in relation to the 2022 actuals
- Equity decreased due to the negative result in 2023.
- Current liabilities increased due to additional funds received under the Administrative Agreement in 2023, but not spent in full in 2023. In addition, the liability for holiday allowance and holiday time was higher due to the CLA indexation in 2023.
Ratios
table 16
| Inspectorate of Education (IvhO) financial supervision ratios | ||||
|---|---|---|---|---|
| Ratios | Definition | lvhO signalling value | Actuals 2023 | Actuals 2022 |
| Liquidity | (Receivables + cash and cash equivalents)/current liabilities | < 0,5 | 0,79 | 0,8 |
| Solvency II | (Equity + provisions)/total assets x 100% | < 0,30 | 0,49 | 0,54 |
| Absolute cash and cash equivalents | Balance sheet position as at the balance sheet date | < € 2 miljoen | 148,6 | 127,8 |
| Signalling value for supervision of public equity | ||||
| Ratios | Definition | lvhO signalling value | Actuals 2023 | Actuals 2022 |
| Excessive equity | De signaleringswaarde bovenmatig publiek eigen vermogen is: (0,5*aanschafwaarde gebouwen*1,27)+(boekwaarde overige materiële vaste activa) +(omvangafhankelijke rekenfactor*totale baten) |
Actual public equity > normative equity | Feitelijk publiek vermogen: €166,9 miljoen. Normatief eigen vermogen: €340 miljoen |
€300 million |
| Other Inspectorate of Education (IvhO) ratios | ||||
| Ratios | Definitie | lvhO signalling value | Actuals 2023 | Actuals 2022 |
| Return (1-year) | Result year t/total income t x 100% | < -10% | -2,3% | 1,4% |
| Return (2-year) (retrospective) | ∑ (Result year t-1; result year t)/∑ (total income year t-1; total income year t) x 100% | < -5% | -2,1% | 0,6% |
| Return (2-year) (prospective) | ∑ (Result year t; result year t+1)/∑ (total income year t; total income year t+1) x 100% | < -5% | -2,5% | -0,2% |
| Return (3-year) (retrospective) | ∑ (Result year t-2; result year t-1); result year t)/∑ (total income year t-2; total income year t-1; total income year t) x 100% | < 0% | -0,4% | -0,5% |
| Return (3-year) (prospective) | ∑ (Result year t; result year t+1; result t+2)/∑ (total income year t; total income year t+1; total income year t+2) x 100% | < 0% | -2,7% | -0,1% |
| Buffer capital | Equity/total income x 100% | < 5% | 24,5% | 28,5% |
Development of solvency
Solvency decreased due to the negative result in 2023 and an increase in current liabilities, mainly due to an increase in non-normative central government grants (funds under the Administrative Agreement). The negative result also led to negative profitability for 2023.
Development of liquidity
Both the Inspectorate of Education and internal guidelines use a signalling value of 0.5 for the liquidity ratio. Based on the 2023 consolidated figures, the liquidity ratio for 2023 exceeds the signalling value of 0.5. The liquidity ratio is subject to changing market conditions and may vary. As a result, the signalling value serves as an indicator rather than a given fact.
The expected real estate investments within the CiO III (and IV) programme in the coming years will put pressure on the liquidity position. A financing requirement is expected to arise in 2025 when the CiO investments are realised in terms of scale and timing based on the recent investment estimate. See also the notes in the Investments section. This will create a negative liquidity ratio from 2025 onwards. However, this negative liquidity ratio from 2025 does not yet take into account the fulfilment of the financing requirement by raising funding (and the related financing burden). If funding is raised to cover future deficits, there will be no material deviation from the applicable signalling limits.
Signalling value for potentially excessive public equity
As at year-end 2023, EUR’s actual equity (public portion of equity) amounted to € 166.9 million. The normative equity for EUR as at year-end 2023 is € 340 million.
The public equity therefore does not exceed the signalling value for potentially excessive public equity of educational institutions.
The figures as shown in the separate balance sheet and the separate statement of income and expenditure form the basis for calculating the actual equity and the normative equity.
Going concern paragraph
Introduction
The going concern paragraph provides insight into long-term external and internal future developments relevant to the development of the results and equity.
We start with an explanation of key external developments, followed by an explanation of elements of the multi-year budget. The multi-year budget was adopted by the Executive Board on 7 November 2023 and approved by the Supervisory Board on 18 December 2023.
Key external developments
Economic climate
The economic climate in higher education is influenced by several factors, including government policy on education budgets, labour market developments and internationalisation. The ongoing war in Ukraine and the fallout in the wake of the COVID pandemic maintained the upward price trend in 2023. Energy prices rose sharply, contributing to inflation directly (cost of energy consumption) and indirectly (cost increase in products and services due to higher energy costs). Inflation also affects wage trends in the collective labour agreement. These wage increases may not be fully compensated by the Ministry of Education, Culture and Science (OC&W). Tuition fees are also not rising sufficiently with inflation in the current academic year. Inflation fell in early 2024.
Political climate
In July 2023, the Rutte IV cabinet tendered its resignation. Due to the outgoing government, a number of important decisions or laws have not yet been addressed. The result is a significant delay in decision-making on a number of issues that are crucial to EUR, such as the Balanced Internationalisation Act (Wet Internationalisering in Balans, WIB). The impact of the WIB and BSA will vary from faculty to faculty.
On 16 May, PVV, VVD, NSC and BBB presented the Framework Coalition Agreement (Hoofdlijnenakoord, HLA) 2024-2028. Although the details are yet to be worked out after the new government is formed, it is already clear that there will be significant cuts to education and science. It can be expected that taking additional measures will be unavoidable.
Labour market shortages, collective labour agreement developments and average staffing costs
The labour market shortages are expected to continue, affecting both retention and attraction of new staff. Faculties and departments drew attention to this problem in 2023 for both academic and support staff. As a result, the workload remains high, there is upward pressure on average staffing costs and the scale and cost of hiring external staff is also affected.
CLA developments play an important role in the development of staffing costs. The higher staffing costs in 2023 due to the CLA increase have not been fully compensated by OC&W and cannot be passed on in full in externally funded research projects. This is carried over into subsequent years. The current CLA runs until 30 June 2024. Initial negotiations for the new CLA started in early 2024, which will impact the university's financial position after July 2024.
Investments
Campus in Development investments
EUR decided in 2020 to develop campus Woudestein into a campus of international allure, with high study and job satisfaction. The overall programme is divided into three phases, with phase III starting in 2016 and running until 2028.
No new-build projects were completed in 2023. However, the tender process for the Tinbergen renovation has started, with the expectation that it can be completed in spring 2024.
In the same year (2023), GHP sources were installed to make the Campus' energy supply more sustainable, contributing to a demonstrable improvement in energy efficiency. A European tender for electricity supply has also been finalised and the transition to the new supplier will be completed in 2023.
In response to the sharp increase in construction costs, the decision was taken in 2023 to increase the budgetary framework for the Tinbergen renovation. An investment estimate totalling € 302 million has been included for the projected completion of CiO III up to the end of 2028. This may prove insufficient due to construction price trends. In a general sense, the combination of the overheated construction market and the high demands of users remains an area requiring attention for EUR. As a result, the investment estimate for the CIO III (and IV) programme is subject to change. The current estimate for the CIO III and IV programmes respectively over the period 2024-2028 is € 206 million and € 50 million. Scenario analyses and forecasts prepared in the context of liquidity monitoring seek to take this into account.
Total expenditure up to 2023 cumulatively amounts to € 121 million. Total expenditure in the year 2023 is € 7.3 million.
The full charging on of investment decisions, including maintenance and facility services, to structural costs is standard practice. Several go/no-go moments have been built into all projects, while a governance structure overseen by the vice chair of the Executive Board monitors operational and financial progress.
A key focus point is the redefinition of the RE&F real estate strategy, as elaborated in the policy document Tomorrow's Campus. In early 2023, the smart fit scenario was chosen, which focuses on more efficient and sustainable use of existing facilities rather than adding new ones. Concrete investment decisions will be made in 2024 based on further exploration and insights.
During the reporting year, the decision was also taken to transfer the project management for the development of student housing on Abram van Rijckevorselweg to the municipality of Rotterdam, with the aim of utilising the municipality's expertise and reducing the pressure on RE&F's implementing organisation.
Due to investments in the context of the CFO III programme, EUR anticipates that the Woudestein premises costs will range between € 45 million and € 50 million per year between 2023 and 2026.
Level of IT investments
In the coming years, EUR will continue to invest heavily in digitalisation. An annual amount of € 5 million is available for digitalisation initiatives for education, research and operational management. In addition, EDIS has an annual budget of € 3 million for Life Cycle Management trajectories in IT-for-IT(network, storage, computer and so on).
The State of Digitalisation inspiration document provides the guidelines for the digital roadmaps. Key objectives include updating the operational management systems and the flexible and agile deployment of modern digital services. The transition to the cloud is therefore underway. Following on from solutions for data storage and back up that have already been migrated in 2023, almost all EUR applications will also be housed in cloud environments of suppliers and EUR itself by 2027 at the latest.
Work is also underway on the preparation and development of a new digital working environment for all employees and initial steps will be taken towards sourcing EUR WiFi and LAN solutions in 2024. In the meantime, EDIS is working with its stakeholders to shape its services increasingly according to Agile work processes, allowing delivery at a faster pace and in better alignment with the client.
Expected numbers of students
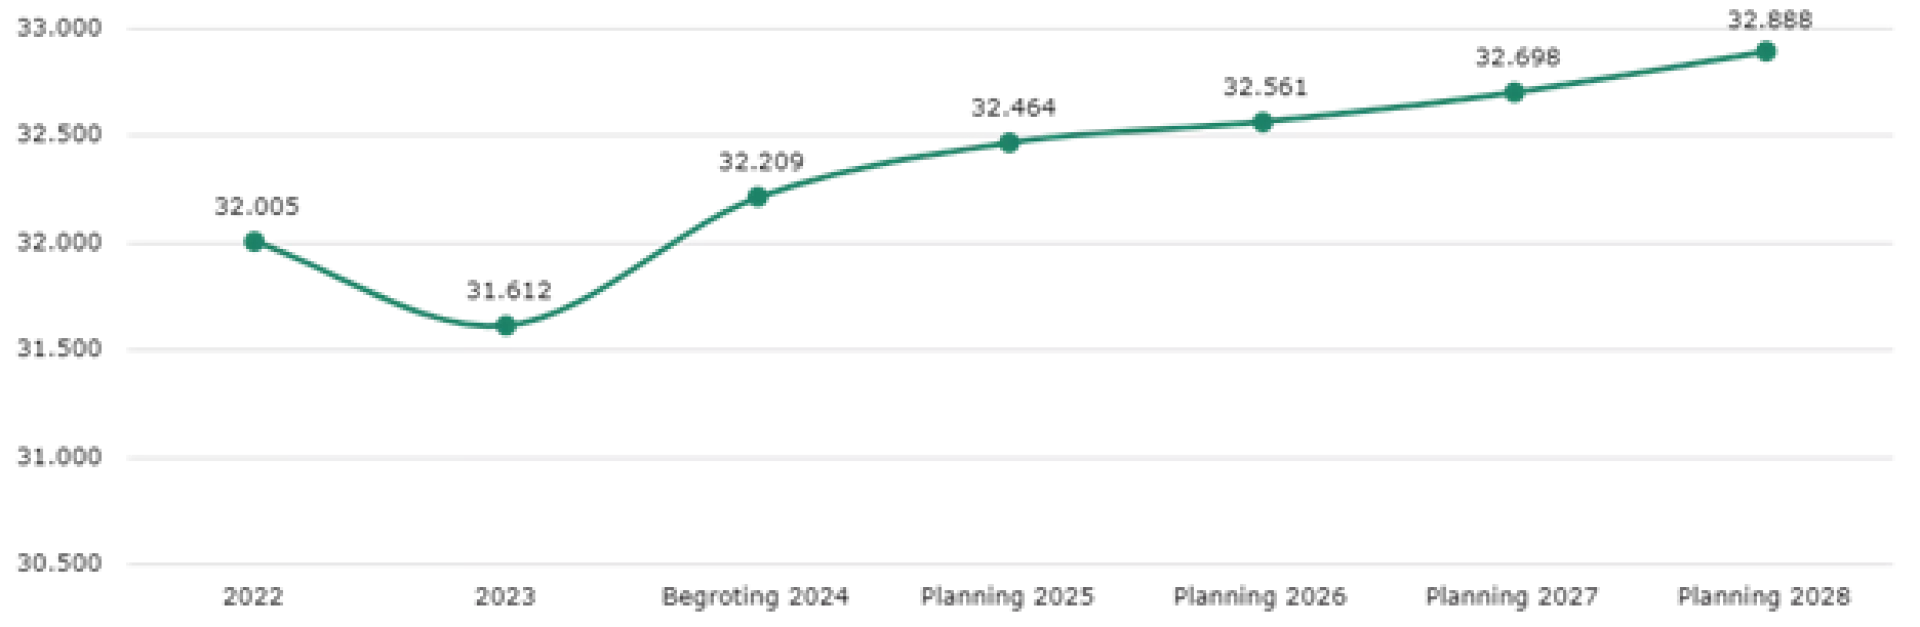
The figures for 2023 show a notable decrease in the number of students (31,612) compared to the budget (33,207). The decrease in the number of students compared to the budget is due to lower intake of new students. This is in line with the national trend (downward adjustment in the reference forecast).
Alongside the decrease in the number of students (-/- 1.23%), the number of enrolments is also falling (-/-1.41%). Enrolment on bachelor programmes is down, whereas enrolment on master programmes is up. The decrease in the number of students mainly relates to EEA students (-/- 1.50%). Last year, the number of students from outside the EEA increased (+/+ 2.50%).
The Framework Coalition Agreement was published in May 2024. More detailed information on the further elaboration of the points in the Framework Coalition Agreement is not yet available. Political decision-making on issues such as the Balanced Internationalisation Act (Wet Internationalisering in Balans, WIB) Act is crucial. For example, implementation of the WIB will have an impact on the break with past trends in terms of the growing number of international students. A drop in the number of students has negative implications for the central government grant and tuition fees. These financial effects are not yet known and are therefore not yet included in the multi-year budget.
The aforementioned trend relates to the year 2023 compared to budgeted. For the future, very limited growth or stabilisation is expected based on the projected Higher Education figures of the Education Executive Agency (Dienst Uitvoering Onderwijs, DUO). This does not take into account the impact of the downward adjustment in the new 2024 reference forecast.
Expected staffing
table 18
| 2023 | 2024 | 2025 | 2026 | 2027 | ||
|---|---|---|---|---|---|---|
| fte academic staff | fte academic staff | 2.377 | 2.348 | 2.271 | 2.266 | 2.252 |
| fte PhD | fte PhD | 830 | 903 | 875 | 880 | 893 |
| fte student assistant | fte student assistant | 141 | 154 | 153 | 151 | 151 |
| fte support and management staff | fte support and management staff | 2.479 | 3.028 | 3.012 | 3.007 | 3.009 |
| fte Executive Board | fte Executive Board | 3 | 3 | 3 | 3 | 3 |
| Total | Total | 5.830 | 6.436 | 6.314 | 6.307 | 6.308 |
Total staffing levels will decrease from 2024 onwards. The increase in academic staff is related to the Administrative Agreement funds, which will be used for the grants in 2024. The number of academic staff will stabilise from 2025 onwards. The funds from the Administrative Agreement and the collective labour agreement increase help to attract and retain staff. Encouraging more permanent contracts and resources for reducing the workload contribute to a positive working environment at Erasmus University Rotterdam. Nevertheless, labour market shortages, which make it difficult to retain and attract staff, continue to affect FTE development.
Trends and developments
Multi-year budget
Multi-year balance sheet
table 19
| 2023 | Budget 2024 | Planning 2025 | Planning 2026 | Planning 2027 | |
|---|---|---|---|---|---|
| Assets | |||||
| Fixed assets | |||||
| Intangible fixed assets | 3,0 | 7,6 | 11,6 | 11,6 | 11,6 |
| Tangible fixed assets | 289,8 | 288,8 | 345,4 | 385,4 | 375,6 |
| Financial fixed assets | 1,5 | 0,4 | 0,4 | 0,4 | 0,4 |
| Total fixed assets | 294,3 | 296,8 | 357,4 | 397,4 | 387,6 |
| Current assets | |||||
| Inventories | 0,0 | 0,0 | 0,0 | 0,0 | 0,0 |
| Receivables from tuition fees | 0,7 | 1,5 | 1,6 | 1,7 | 1,7 |
| Other receivables | 39,1 | 37,0 | 36,5 | 36,5 | 36,5 |
| Cash and cash equivalents | 148,6 | 95,6 | 52,9 | 23,3 | 41,3 |
| Total current assets | 188,4 | 134,1 | 91,0 | 61,5 | 79,5 |
| Total assets | 482,7 | 430,9 | 448,4 | 458,9 | 467,1 |
| Liabilities | |||||
| Equity | 211,1 | 190,3 | 190,3 | 190,3 | 190,3 |
| Provisions | 26,0 | 22,3 | 22,3 | 22,3 | 22,3 |
| Non-current liabilities | 7,3 | 6,8 | 6,5 | 6,2 | 5,9 |
| Current liabilities | 238,3 | 211,5 | 229,3 | 240,1 | 248,6 |
| Total liabilities | 482,7 | 430,9 | 448,4 | 458,9 | 467,1 |
Notes to the multi-year balance sheet
Developments
Despite the fact that the normalised result was more positive than budgeted, there appears to be a structural loss. A loss for EUR Woudestein of € 24.9 million is budgeted for 2024. If no measures are taken, the result is expected to also be negative in subsequent years, with the potential result that equity could fall too low. Given the ambition to continue investing in real estate and digitalisation, such an evaporation of assets is not acceptable. EUR is therefore taking measures to achieve a balanced operation in the future and thus maintain its equity. Broadly speaking, the measures cover the following four categories:
- decisions on the prioritisation and postponement of activities;
- cost reduction;
- rationalisation and harmonisation of support processes;
- increasing revenues.
The increase in assets is due to investments in IT (new operational management system, intangible fixed assets) and real estate (renovation of Tinbergen building and Campus in Development, tangible fixed assets). The multi-year budget is based on the assumption that these investments will be largely self-financed, putting further pressure on the liquidity position. The multi-annual budget included above does not take into account the fulfilment of the expected financing requirement from 2025 onwards.
The movement in current liabilities mainly relates to the recognition of advance non-normative components of the central government grant, as stipulated in the Administrative Agreement.
Income and Expenses
table 20
| In € million | Actuals 2023 | Budget 2023 | Planning schedule 2024 | Planning schedule 2025 | Planning schedule 2026 | Planning schedule 2027 |
|---|---|---|---|---|---|---|
| Central government grant | 429,8 | 446,0 | 457,2 | 462,4 | 470,1 | 469,9 |
| Tuition fees | 80,9 | 80,1 | 88,9 | 96,1 | 98,6 | 98,9 |
| Income from work commissioned by third parties | 236,0 | 221,8 | 247,2 | 245,1 | 246,3 | 245,9 |
| Other income | 115,8 | 111,2 | 122,7 | 119,6 | 118,5 | 119,3 |
| Total income | 862,5 | 859,1 | 916,0 | 923,3 | 933,5 | 934,0 |
| Personnel expenses of staff on payroll | 572,0 | 604,3 | 628,8 | 631,8 | 631,8 | 631,4 |
| Staff not on payroll | 37,9 | 32,9 | 31,1 | 30,4 | 30,8 | 31,9 |
| Depreciation | 54,1 | 44,1 | 42,8 | 43,6 | 46,3 | 47,4 |
| Premises costs | 41,7 | 44,5 | 46,5 | 48,6 | 50,8 | 46,6 |
| Other expenses | 187,2 | 166,5 | 187,4 | 192,2 | 193,4 | 195,8 |
| Total expenses | 892,9 | 892,3 | 936,6 | 946,6 | 953,1 | 953,1 |
| Net income (expense) | -30,4 | -33,2 | -20,6 | -23,4 | -19,6 | -19,1 |
| Financial income and expenses | 7,5 | 0,6 | 2,7 | 2,7 | 2,7 | 2,6 |
| Taxes | 0,2 | 0,0 | 0,0 | 0,0 | 0,0 | 0,0 |
| Result for the year | -22,7 | -32,6 | -17,9 | -20,7 | -16,9 | -16,5 |
| Third-party share of result | -3,0 | -17,0 | 7,0 | 7,0 | 7,0 | 7,0 |
| Net result for the year | -19,7 | -15,6 | -24,9 | -27,7 | -23,9 | -23,5 |
| Target | - | - | - | 27,7 | 23,9 | 23,5 |
| Net result incl. target | -19,7 | -15,6 | -24,9 | - | - | - |
Notes to the multi-year income and expenses
In order to remain financially stable, the Executive Board decided to jointly task the faculties and services at campus Woudestein with preparing a result-neutral budget from 2025 onwards. To achieve this multi-year budget, collective agreements will be made during 2024 and implementation started to meet this requirement in 2025.
The multi-year budget shows a limited increase in income from central government grants. This concerns an increase due to compensation for wage and price increases and additional earmarked funds for aspects such as cyber security, student well-being, social safety and a smarter academic year. The downward revision of the reference forecast reduces revenues from €8.4 million in 2024 to €15.6 million in 2027.
Staffing costs account for around 70% of the total costs. Developments in wage costs therefore have a significant impact on the budget. The CLA increase in 2023 was not fully covered by compensation from OC&W and it is uncertain whether future increases will be fully compensated. The university continues to focus on a 5% maximum limit for external hiring. Hiring in less external capacity means that overall labour costs remain somewhat stable. Thanks to the current labour market shortages, attracting and retaining staff remains a challenge.
Depreciation charges are set to increase due to investments in property, IT and rising construction prices. The rising depreciation charges were not immediately reflected in the multi-year budget (2024 compared to 2023) due to a miscalculation of budgeted investments. See also the above notes under Balance sheet and development in cash flows. This was subsequently corrected.
Risk management
Risk management and control system
Risks and uncertainties
In the pursuit of a solid and well-functioning organisation, EUR maintains a robust control framework. This framework is based on joint policy-making, anchored in EUR's broad strategy and supported by all stakeholders, including the Executive Board, deans, directors of support services and education and research directors. At the centre of this framework lies an interactive management philosophy, in which a decentralised management culture and integrated management of decentralised managers are essential, but always within the established frameworks of the Executive Board.
The internal control system incorporates various regulations and procedures designed to provide reasonable safeguards and to identify and control significant risks. This approach is further supported by a well-thought-out risk management policy and a robust risk and control framework. Part of the risk and control framework is determining the risk appetite within the established university frameworks. The determination of the risk appetite is a responsibility of the Executive Board, which also submits this to the Supervisory Board. Risk appetite is not a given fact and, due to social developments, is subject to change. EUR subscribes to the Association of Universities in the Netherlands (Vereniging van Universiteiten in Nederland, VSNU) Code of Good Governance.
This risk section elaborates on the specific risks that may affect the financial and operational health of the university, as well as the measures taken to manage and mitigate these risks.
Compliance
Compliance with the Treasury Statute
The purpose of the Treasury Statute is to establish a framework within which EUR's treasury activities should take place. This involves establishing the principles, objectives, guidelines and limits for the implementation of the treasury function in the form of policy. The Treasury Statute is also designed to reflect the administrative organisation and internal control in relation to the treasury activities in order to manage EUR's financial resources efficiently and effectively.
The Treasury Statute defines the areas of responsibility of the treasury function. The treasury function has the primary aim of managing financial risks and includes the following areas of responsibility within EUR:
- Liquidity management: ensuring the timely availability of the necessary cash for the short, medium and long term, at acceptable conditions (availability).
- Management of interest rate risk: optimisation of returns on surplus cash and cash equivalents within the frameworks of the Treasury Statute (interest rate optimisation).
- External financing: raising loan capital and minimising the costs of loans (cost minimisation).
- Financing: providing loans, grants and security to related parties and non-consolidated institutions, in the context of performing the statutory task, while minimising financial risk (risk minimisation).
- Maintaining banking relationships: maintaining relationships with financial institutions with a view to the availability of financial resources and optimal conditions (banking relationships).
The Treasury Statute complies with the OC&W Regulation on Investing, Borrowing and Derivatives 2016 (Regeling beleggen, lenen en derivaten van het Ministerie van OCW 2016). The Treasury Statute was updated in 2023. The main change concerned the relationship with related parties in terms of liquidity management and financing. The transactions that took place in 2023 were in line with our university's Treasury Statute. EUR uses treasury banking, in which excess liquid funds are held by the Ministry of Finance.
The university has no investments.
Reporting on expenses claimed by Executive Board members for 2023
The letter from the State Secretary of OC&W of 25 November 2011 sets out agreements regarding the transparency of Executive Board members’ expense claims. The Executive Board members’ expense claims for 2023 are presented below.
In the financial statements, the amounts claimed in expenses by the Executive Board members are presented in accordance with the format prescribed by the State Secretary. The State Secretary defines expense claims as follow: claims submitted to EUR by individual Executive Board members for costs incurred or services rendered. The table below provides a breakdown of the expense claims submitted by each Executive Board member.
table 21
| prof. dr. H. Brinksma | prof. dr. A.L. Bredenoord | dr. E.M.A. van Schoten RA | ||
|---|---|---|---|---|
| Expense allowance | Onkostenvergoeding | 24.496,32 | 6.496,32 | 6.496,32 |
| Representation allowance | Representatievergoeding | - | - | - |
| Travel costs Netherlands | Reiskosten binnenland | 13.031,49 | 10.908,17 | 15.389,05 |
| Travel costs abroad | Reiskosten buitenland | 4.373,12 | 2.783,63 | 7.123,07 |
| Other costs | Overige kosten | 1.843,26 | 22,50 | 2.635,81 |
| Total | Totaal | 43.744,19 | 20.210,62 | 31.644,25 |
Clarity Memorandum and compliance with new policy rules
Clarity Memorandum and compliance with new policy rules
The purpose of the 2003 Clarity in the Funding of Education Memorandum (Notitie Helderheid in de bekostiging van het onderwijs) and the 2004 supplementary memorandum is to provide clarity to publicly funded universities and universities of applied sciences on the interpretation and application of the existing funding rules for the computation of the funding parameters as of 1 October 2023 and for subsequent years. These memorandums cover nine themes.
Explanation of the themes, focusing on the situation at EUR at the closing date of 2023
- Outsourcing of education
- Investment of public funds in private activities
In the Erasmus School of Economics (ESE) Faculty, a limited part of the curriculum is delivered by FEI B.V., an institute affiliated with the faculty. This relates to specific topics. The faculty remains responsible for educational quality. FEI B.V. charges costs for this, on the basis of the transfer pricing policy. Furthermore, EUR did not outsource any other CROHO-registered programmes or components thereof to private organisations and other institutions in 2023.
This theme has been dropped. Reporting from 2023 based on the policy rules on investment of public funds in private activities.
Principles
In drafting the reporting based on the new policy rules, the following principles have been applied:
- The starting point is the policy rules on investment of public funds in private activities, taking into account the relaxations announced by OC&W for the 2023 annual report (letter dated 3 October 2023 with reference 41136624). EUR has internally prepared a draft policy document and developed a full cost model for secondment and accommodation. These policy documents will be finalised in 2024 once there is more clarity on the scope and interpretation of these new policy rules.
- EUR, including the E&R component of FGG/EMC, is required to comply with this policy rule. Related parties fall within the scope of the policy rule if public funds of EUR are involved in carrying out specific activities. In such cases, EUR reports the relevant activities. In the financial statements, the assets of the related parties (EUR Holding BV and RSM BV) are classified as private equity.
- EUR contributes to the well-being of students and staff by offering sports facilities. This is done primarily to promote an inspiring learning and working environment. These facilities are usually only accessible to the university community and are managed by the Erasmus Sport Foundation. As these activities fall within EUR’s public task, they essentially do not need to be accounted for under the policy rule. However, EUR chooses to do so in the context of transparency. EUR provided a contribution of € 1.5 million in 2023. Stichting Sport's result for the calendar year 2023 is € 0.1 million negative.
- EUR carries out valorisation activities through Erasmus Enterprise BV, including facilitating infrastructure for startups and supporting early stage ideas and companies. This is essentially done with the aim of transferring knowledge to society without market distortion. In EUR's view, these activities fall within its public task and therefore do not need to be reported on. For the calendar year 2023, the contribution to Erasmus Enterprise for the performance of valorisation activities was € 1.7 million. Erasmus Enterprise BV realised a result of € 0.1 million negative for the calendar year 2023. YES!Delft (Europe's largest high-tech incubator) also receives an annual contribution from EUR of around € 0.7 million.
- EUR provides services to related parties, for which a total of € 11 million of recharged costs were calculated in 2023, mainly for the hiring of staff and for accommodation. In turn, the related parties also provide services to EUR, for which a total of € 20 million was charged on in 2023, mainly for the hiring of staff. The agreements in the transfer pricing document determine this charging on.
- See the Going concern paragraph for a description of risk policy and management.
Private activities in which public funds are invested
Based on the above criteria, EUR distinguishes between the following categories of private activities (EUR sec):
- contract education (income: € 2.7 million);
- contract research (income: € 3.9 million);
- leasing (income: € 8.0 million);
- secondment (income: € 5.3 million);
- other service revenues (income: € 2.8 million).
Contract Education
In the faculties and services, non-funded education activities take place on a limited scale, to a collective value of € 2.7 million. The main contributor to this amount is revenue from the EUR Language and Training Centre, primarily for providing language courses to EUR students and staff. For the calendar year 2023, the language centre realised an amount of € 0.8 million in income from contract education and achieved a positive result of € 0.1 million, thus breaking even. Other contract education (totalling € 1.9 million) is very limited in scale (individual education activities are < € 20,000). Given the administrative burden, faculties and departments do not keep separate records for these activities, so it cannot be accurately determined to what extent these activities are self-financing. The extent to which this process needs to be refined will be further examined in 2024.
For the sake of completeness, we note that the International Institute of Social Studies (ISS) realised an amount of € 3.0 million in income from contract education in 2023. We see providing this education as an integral part of our core public tasks. We explain this in more detail below.
The International Institute of Social Studies (ISS) is an EUR institute offering global education and research. This mainly comprises accredited master and PhD programmes in academic education for students from developing countries, as well as related research and capacity building.
The ISS receives funding for its activities, including a contribution from the Ministry of Foreign Affairs, through the central government grant that EUR receives from OC&W. This specific contribution is earmarked and is transferred directly to ISS by EUR. With this contribution and the contributions ISS receives from other grant makers (such as Nuffic), education is provided and research is carried out.
Contract research
Within Erasmus University Rotterdam, research and valorisation projects are carried out for parties such as international organisations, the Dutch Research Council (Nederlandse Organisatie voor Wetenschappelijk Onderzoek, NWO), authorities and the business community. Whether a project is public or private in nature is recorded in the project administration. Based on the analysis carried out, it appears that only a limited proportion of research projects can be classified as private activities. These are mainly studies for private parties, also referred to as private third flow of funds research. This concerns a sum of over € 4.3 million. The positive results of these activities amounted to € 0.5 million in 2023 (based on closed research projects). Contract research did not involve investing public funds in private activities. EUR's policy stipulates that private contract research must be carried out at rates that at least cover the full cost price, which means that structural financial dependence on public funds is neither sought nor expected.
Leasing
Total lease income in 2023 was over € 8 million, including income from parking revenue and the charging on of service charges. A significant part of this income (€ 5.2 million) comes from leasing to EUR’s related parties for purposes such as commercial and non-commercial education, research and entrepreneurship. Leasing space to related parties helps promote Lifelong Development and encourage entrepreneurship, thus making a positive contribution to society. Under EUR's policy, the rates charged for leasing are based on a full cost price model and therefore break-even. No separate records are kept for costs per leased property. The remaining portion of lease income (€ 2.8 million) mainly concerns leasing to commercial parties (operators). These lessees are also charged a full cost lease amount. Service costs are also passed on in full to lessees.
The Real Estate & Facilities (RE&F) department is responsible for these activities. Leasing space to operators provides added value by strengthening the campus community and making the university more attractive. This promotes social interaction and the well-being of our students and staff.
Secondment
EUR seconds staff mainly to its related parties and to a lesser extent to other universities and other institutions. These activities take place within almost all faculties. No distinction is currently made between public and private secondments. The added value lies in enriching the staff members’ expertise and promoting synergy between academic knowledge and practical applications. While the content and purpose of EUR secondments are different in each individual case, the broad conclusion is that secondments take place exclusively in line with EUR's funded statutory tasks focusing on education and research. For this reason, the added value of secondments has a public nature and purpose. In 2023, the total revenue from secondments amounts to € 5.3 million. A significant part of this revenue (€ 4 million) concerns secondments from faculties to EUR-related parties. When a EUR employee is exchanged with a related party, the rate is usually determined using the transfer-pricing master file. The resulting amounts exceed the full cost price. In principle, this practice also applies to secondment to third parties (€ 1.3 million).
Other revenue from services
These are mainly other services related to education and research, such as the use of available expertise and teaching materials from Erasmus University Rotterdam. This concerns many transactions for services performed that are relatively limited in size (totalling € 2.8 million). The result of these services are accounted for in public equity. An internal test determined that the services were offered at break-even.
Reporting on E&R activities (FGG/EMC)
Under the policy rule on investment of public funds in private activities, UMCs have a special position due in part to the mixing of core tasks. In September 2023, the Dutch Federation of University Medical Centres (Nederlandse Federatie van Universitair Medische Centra, NFU) adopted a guideline on how the policy rule applies to UMCs. See below for an explanation of what this policy rule means for Erasmus MC.
Within Erasmus MC, there is a separation of core tasks between Care and E&R, with the E&R segment corresponding to the faculty. In accordance with the guideline, the above-mentioned policy rule does not apply to the healthcare segment and directly related activities, including the operation of the Atrium and car parks.
Within the E&R segment, there is a primary separation between private and public activities through the holding company structure, with the operation of private activities taking place within the holding company. The holding company's strategy and policy document sets out the rules in this regard, including on transfer pricing with Erasmus MC and alignment with the core tasks. This policy ensures that activities carried out within the holding company comply with the new policy rule.
Within the E&R segment, all activities fall under the core tasks of research, education and valorisation, which means only public activities.
Reporting on related parties
EUR has two participating interests on its balance sheet that are reported on under private equity: EUR Holding BV and RSM B.V. These participating interests have their own financial operations. They are effectively stand-alone organisations that must operate at break-even and are therefore responsible for achieving a balanced multi-year operation.
EUR Holding BV
Under the umbrella of EUR Holding B.V., several operating companies operate in executive and post-graduate education, conducting research on behalf of third parties and providing consultancy services. In 2023, education activities generated € 20.6 million in turnover, while revenue from contract research was € 8.7 million.
In addition, within EUR Holding B.V. there is the operating company EUR Flex B.V., which focuses exclusively on secondment. This branch seconds staff mainly to support the university's operational management. Transfer pricing is used here.
RSM BV
The principal activity of RSM BV is the provision of executive and post-graduate education. In 2023, education activities generated € 19.6 million in turnover.
Summary
Below is a complete overview of all private activities that must be reported under the policy rules. This concerns the actual income and actual indicative result. For the sake of completeness, we have also included the contributions to the Erasmus Sport Foundation and Enterprise BV and the amount of contract education provided by ISS in the overview (as these are public activities).
Indicative result of public and private activities
table 22
| Private activities | Private income in 2023 | Estimated investment of public funds | Indicative result |
|---|---|---|---|
| Private contract education | € 2.7 million | € 2.7 million | -/- € million - |
| Private contract research | € 3.9 million | € 3.6 million | +/+ € 0.3 million |
| Leasing | € 8.0 million | € 6.5 million | +/+ € 1.5 million |
| Secondments | € 5.3 million | € 5.0 million | +/+ € 0.3 million |
| Other revenue from services | € 2.8 million | € 2.8 million | -/- € million - |
3. Granting of exemptions
EUR does not grant exemptions to students for the sole purpose of attracting students and thus increasing the central government grant without students making a commensurate effort in return. In order to qualify for an exemption, this effort must be established by the Examining Board.
4. Funding for international students
Only students whose name and address details are known to EUR and who also meet all funding requirements are counted for the purpose of funding.
5. Tuition fees not paid students and Profiling Fund
EUR does not pay tuition fees for students. The arrangements provided for by the Profiling Fund grant financial compensation for study delays due to personal circumstances, for board scholarships and for fee waivers. Appendix 7 to the annual report contains the required data for the profiling fund.
6. Students attending degree programme modules
It is possible for non-students to attend modules or parts of degree programmes. This is known as contract education. It involves attending one ore more standalone courses and registering as a course participant rather than a student.
7. Students attend a degree programme other than that for which they are enrolled
Not applicable. Students at EUR attend the degree programme for which they are enrolled.
8. Funding for customised programmes
Regarding initial education, no customised programmes have been set up with companies and other organisations.
9. Funding of arts education
Together with Codarts Rotterdam, EUR has set up a Double Degree RASL programme (Rotterdam Arts and Sciences Lab). The students are enrolled at both institutions but are funded through Codarts rather than by EUR.
10. Number of students to be included in the computation of funding
EUR registers students who meets all enrolment requirements and who also meet all funding requirements as a funded student in BRONHO, the basic database for students in higher education. Provided that all funding requirements have been met, a successfully completed examination is also registered as funded in BRONHO.
Reporting on Administrative Agreement funds
Administrative Agreement
The Administrative Agreement between the Ministry of Education, Culture and Science, research universities and universities of applied sciences was concluded in July 2022. Every year, EUR receives around € 50 million in additional funds under this Administrative Agreement. This amount takes into account setoff for the flat-rate basic grant and Van Rijn. These additional funds have been designated by OC&W as a non-normative central government grant and thus earmarked for a specific purpose. The non-normative central government grant is allocated to the period in which the expenditure is made. The starting point for making these funds available is to strengthen the higher education system, strengthen science and resolve fundamental problems. In short, strengthening the foundation of the system, relief and breathing room for diverse talent within the system and increasing societal impact. Starting and incentive grants and sector plans have been established to reduce workloads and attract researchers. The Starting Grants are essentially structural resources; the Incentive Grants are not.
Starting and incentive grants
A sum of € 31.2 million was made available for the starting grants in 2022 and 2023, of which € 25 million was earmarked for direct costs. The EUR-wide policy on allocation and spending was established in mid 2023. Funds were distributed to faculties on the basis of this policy.
A total of 96 grants were awarded in 2023. Spending in 2023 was € 6.6 for both direct and indirect costs. See the table below for more information. Spending plans have been drawn up for the unspent portion. The limited expenditure on grants awarded is partly due to longer lead times in recruitment processes for new employees funded by starting grants.
The table below shows the number of grants awarded, budget and utilisation of the 2022-2023 budget.
table 23
| Starting grants 2022-2023 | |||||||
|---|---|---|---|---|---|---|---|
| Discipline/HOOP area | Grants | Female | Male | Budget | Direct costs | Indirect costs | Total costs |
| Health | 14 | 7 | 7 | 3.907 | 25 | - | 25 |
| Economy | 43 | 18 | 25 | 10.813 | 244 | - | 244 |
| Law | 11 | 5 | 6 | 3.651 | 58 | - | 58 |
| Behaviour & Society | 25 | 21 | 4 | 6.605 | 29 | - | 29 |
| Miscellaneous | 3 | 0 | 3 | 720 | 1 | - | 1 |
| Central | 0 | 0 | 0 | - | 0 | 6.244 | 6.244 |
| Total | 96 | 51 | 45 | 25.696 | 357 | 6.244 | 6.601 |
Direct costs were spent on:
- Appointment of PhD students € 112,000, all temporary appointments.
- More research time for grant holders € 183,000.
- Research facilities € 62,000.
See section 5 for notes on the starting grants.
A total sum of € 18.2 million was made available for the incentive grants in 2022 and 2023, of which € 14.6 million was earmarked for direct costs.
The Minister has set up a working committee to advise on aspects such as criteria that can be applied to the allocation of incentive grants and other policy issues related to the use of these grants. The opinion of this committee was expected in the first quarter of 2023 and was submitted to the Minister of Education, Culture and Science in June 2023. The Minister's response to this opinion was submitted to the House of Representatives in December 2023.
EUR has worked in parallel with this national working committee to develop internal policies in relation to spending frameworks and internal distribution of funds to the faculties. Given the complexity of the subject matter, the decision-making process has taken considerably longer than initially planned. The decision-making process was completed in November with the agreement of the University Council. Faculties started developing and preparing faculty policy on incentive grants in 2023. Based on this policy, incentive grants will be awarded to eligible employees in 2024.
A full cost model (FCM) has been developed based on the 2022 financial statements. This model forms the basis for full cost pricing for private activities. The outcome of the FCM is a mark-up percentage for indirect costs relative to staffing costs. This mark-up percentage allocates both faculty and central overheads. A percentage is also added for risk premium. The FCM gives a total mark-up percentage of 24.5% (21.4% excluding risk premium). The Administrative Agreement stipulates that a maximum of 20% of funds received can be used for indirect costs. EUR therefore caps the overhead percentage in relation to starting and incentive grants at 20%. This is in line with the Administrative Agreement.
Sector plans
For the sector plans, these are funds (up to the end of 2028) that are allocated to faculties on the basis of submitted plans. The main focus for the coming period is to monitor and report on the use and expenditure of funds to the Ministry of Education, Culture and Science as well as to the sector plan committees. The sector plans are divided into three components: the SSH-Wide Sector Plan, the DSW Sector Plan and the ESHCC and ESPhil Sector Plan.
SSH-wide sector plan
During 2023, a university task force consisting of representatives (deans and/or vice-deans) from the six participating faculties (ESE, ESHCC, ESL, ESPhil, ESSB and RSM) prepared a blueprint for specific collaboration in the context of the Erasmus SSH-Wide Sector Plan. Following approval by the Executive Board, the 36 FTEs available within this sector plan were filled by the appointment of assistant professors. Under the management of two theme leaders per theme, these assistant professors will work in five teams on one of the following topics:
- The Digital Society.
- Digitalisation and platformisation of work processes and products.
- Digital decision support.
- Digitalisation, new ways of working and the new employee.
- Work-related cyber risks and cybercrime.
The teams are deliberately designed so that each theme consists of representatives from at least two different faculties. This is done to encourage the envisaged collaboration across faculty boundaries, in the fields of both research and education.
Programme Manager Marianne Breijer (ESL) and Academic Director Prof. Koen Swinnen (ESL) are responsible for the overall, university-wide coordination of the sector plan. They started this task on 1 January 2024. They focus on fostering stronger connections not only between faculties, but also with other universities working on the theme, the municipality and the business community.
ESSB DSW sector plan
In 2023, a total of 19 assistant professors were recruited within ESSB under the DSW sector plan (total: 16.7 FTE). The breakdown by theme is as follows:
table 24
| Assistant professors | FTE | |
|---|---|---|
| Resilience in young people | 4 | 4 |
| Social transitions and behavioural change | 7 | 5.5 |
| Social inequality and diversity | 5 | 4.5 |
| Educational sciences | 3 | 2.7 |
| Total | 19 | 16.7 |
All assistant professor positions for 2023 were therefore filled. The additional assistant professors make a significant contribution to reducing workloads and to national and local collaboration within the sector plan themes. Eight coordinators were appointed within the faculty who, together with the new assistant professors, drew up plans for each theme in terms of research, education and impact. They also represent their theme in national consultations on the sector plans.
A laboratory coordinator (1 FTE) has been appointed within the ESSB faculty for Virtual Reality and Experience Sampling methods. The Expertise Centre for ESM has been established and expertise in research by design is being pooled in the new Erasmus Social Design Hub. Preparations have also been made for the expansion of the VR infrastructure and an investment plan is being drawn up for the Erasmus Behavioural Lab. In accordance with statutory provisions, the Supervisory Board monitors the quality and performance of individual members and of the Supervisory Board as a whole. An internal evaluation took place again in the reporting year. This included input from the Executive Board on collaboration. Topics addressed included developments in the knowledge and skill levels of members, deepening insights into and dialogue with the Executive Board on important, forward-looking themes for EUR and the current information provision by EUR, cooperative arrangements, society and the Ministry of Education, Culture and Science.
An Administrative Agreement project manager (0.2 FTE) was also appointed to manage the coordination and reporting on sector plan funds.
ESHCC & ESPHIL reporting on SSH Sector Plan 2022-2023
In spending SSH Sector Plan funds, ESHCC & ESPHIL mainly focused on recruiting new assistant professors and postdocs over the first 16 months. Thirteen new assistant professors and five postdocs were recruited with a focus on the themes: Cultural heritage and the creative industries, Media and popular culture and Responsible design and use of AI applications, digitalisation and technology. In addition, ESHCC has appointed a data analyst and a PHD coordinator. ESHCC also used the funds to purchase planning software for academic staff (PLAN), and the faculty joined ODISSEI as a participant.
The increase in both academic and support staff provides a boost for research and education in the area of the SSH Sector Plan themes and more specifically the humanities component Tradition in Transition. It helps relieve the workload and improve career prospects. The implementation of PLAN has been completed, which will reduce the administrative workload in the future.
table 25 Assistant professors and postdocs per theme hired by ESHCC & ESPhil
| Cultural heritage and the creative industries, media and popular culture | Cultural heritage | ESHCC |
|---|---|---|
| Media and popular culture | ESHCC | |
| Popular culture in historical perspective | ESHCC | |
| Media & creative industries | ESHCC ESPhil | |
| The Legacy of the Dutch Enlightenment; Postdoc (2x) | ESHCC | |
| Responsible design and use of AI applications, digitalisation and technology | AI & Society | ESHCC |
| Cultural heritage and the creative industries in the digital age | ESHCC | |
| Philosophy of media and AI | ||
| Sustainable AI-driven societal transitions | ESPhil | |
| Postdoc (2x) | ESPhil | |
| Postdoc | ESHCC | |
| ESPhil | ||
| Cross-cutting theme/SSH-wide | Transforming societies | ESHCC |
| Digitalization and responsible business | ESHCC | |
| Mediatization & digitalization | ESHCC | |
| Digital Society | ESPhil |
A sum of € 15.7[1] was made available for sector plans in the Administrative Agreement in 2023. A total of € 11 million was utilised: 70% of the budget. The table below provides an overview of the available budget and spending.
[1] The budget for sector plans was € 17 million. This consisted of € 15.7 million in Administrative Agreement funds and € 1.3 million in non-normative sector plan grant.
table 26
| Sectorplans | Budget 2023 | Actuals |
|---|---|---|
| SSH/DSW | 9.690 | 5.913 |
| Medical | 5.989 | 5.078 |
| Total *€ thousand | 15.679 | 10.991 |
SSH sector plan
table 27
| SSH/DSW | Budget 2023 | Actuals |
|---|---|---|
| ESE | 1.267 | 1.069 |
| ESL | 1.049 | 268 |
| ESSB | 3.643 | 1.899 |
| RSM | 1.463 | 1.139 |
| Esphil | 674 | 216 |
| ESHCC | 1.594 | 1.323 |
| Total *€ thousand | 9.690 | 5.914 |
Medical sector plan
table 28
| Medical | Budget | Actuals |
|---|---|---|
| Total € thousand | 5.989 | 5.078 |
Reporting on the National Programme for Education
The funds spent for the National Programme for Education (Nationaal Programma Onderwijs, NPO) were those allocated in 2021-2022. The spending period runs until 2024.
EUR received over € 22 million to cope with the impact of the pandemic. The table below shows the financial accounts for the funds. The table shows the total available budgets and total actuals.
Total spending of NPO funds
table 29
| Total budget | Actuals in 2023 | Actuals in 2021-2023 | Spending as a % of total | |
|---|---|---|---|---|
| Smooth intake and advancement | 1.188 | 251 | 1.048 | |
| Well-being | 3.869 | 956 | 3.620 | |
| Extra hands in the classroom | 2.167 | 314 | 2.278 | |
| EH of which Covid envelope | 1.084 | 314 | 1.045 | |
| Medical internships | 1.118 | 711 | 892 | |
| Research | 13.661 | 2.536 | 13.067 | |
| Total *€ thousand | 23.087 | 5.082 | 21.950 | 95% |
Theme: smooth intake and advancement of students
Of the total available amount, 88% had been spent on the themes of intake and advancement by year end 2023. The initial target was 100%. The remainder will be used in 2024.
The funds are used for additional guidance. In the first two years, the focus was on eliminating backlogs. In 2023, spending shifted slightly towards improving students' wider well-being or better information provision to students.
Some milestones in 2023:
- The onboarding week for master students at Erasmus School of Economics (ESE) reached nearly two hundred students. Ratings ranged from 8.2 to 10.
- Erasmus School of Health Policy Management (ESHPM) redirected the funds, earmarked for organising additional social activities during and immediately after the COVID-19 pandemic, to workshops focused on personal development.
Apart from this new initiative by ESHPM, no new initiatives were launched with these funds.
Theme: student well-being within faculties
Project spending within this theme works towards improving coping strategies for students in times of crisis. During and immediately after the pandemic, the focus was on creating an online environment for student gatherings. The emphasis in the last two years has gradually shifted to additional study advisors and mentors appointed to provide additional guidance and connect with vulnerable students.
Some milestones:
- The ESE faculty further developed the skills courses initially used to increase student resilience into optional additional personal counselling for students. A total of 75 students took advantage of this counselling.
- ESHPM continued additional activities to celebrate milestones in the student's study career (first year and third year of the bachelor programme).
- Erasmus School of Law (ESL) organised 22 workshops with an average of 20 students to promote student success. As many as 135 individual coaching sessions were held with students and 30 senior students were trained as buddies.
Theme: student well-being within EUR’s central services
A portion of the funds were allocated to the central Student Well-being programme. Additional online student psychologists and counsellors were appointed at the outset. This reduced waiting times for short-term student support. A digital and physical information point was set up in the student living room. Many students find their way to the living room, where they can obtain information from trained fellow students. This ensures that they know where to ask for help inside or outside the university. Data is collected on interventions that promote student well-being. The lessons learned at Erasmus University are shared with the network of Caring Universities. The good news is that all of the provisions led to shorter waiting times for help. Students know where to find help through the accessible information points. There was a budget overrun for facilities such as the student psychologists and counsellors due to increased costs.
Theme: Hands in the Classroom
Under the Hands in the Classroom theme, an existing scheme was continued for the purpose of expanding lecturer capacity. These funds were nearly exhausted and were spent on the temporary deployment of additional lecturer capacity.
Theme: internships (specific to Erasmus MC)
During the first few years, the cost of additional internships was funded from other resources. Since 2022, NPO funds have been used to clear the backlogs that arose during the COVID-19 pandemic. The funds are expected to be spent by the end of 2024.
Theme: research
Research funds have been used to compensate researchers whose research was delayed. These funds were almost fully spent by year end 2023.